2
Reading the Data
14
SR T11 (ET)
20132501
T11
3/28/13 P
BRED HEIFER
STRAIT RANCHES
STETSON 5714
WENDT 4660
WENDT 5637
AL ZEUS 213
1229411
HEFTE RANCH 157
BRIGGS 523/94
HEFTE RANCH 405
WENDT GERONIMO 3983
WENDT 3277
WENDT 4909
SR ISABELLA 557
1255779
KUDO’S GOLDIE 61
KUDO 084/92
WELDER 203/93203/3
Open donor.
1A: Bull calf, DOB 1/23/2015
• KR 865/08 was identified as the highest Marbling EPD (.2) active King Ranch cow in the SGBI database, however was selected
due to her productivity.
• 865/08 belongs to Herd 1A where her dam (KR 615/02) is still active along with 2 daughters and 2 maternal sisters.
• KR 865/08 calved last year on 3/2/14 with this year’s bull calf born on 1/23/15 (10 days before the sale catalog video and
picture).
• Potential sires of the bull calf at side: KR 97/10, KR 613/10, KR 781/13, and KR 143/13. DNA test has been run and the sire of
calf should be confirmed by sale day.
• Top 1% Marb, Top 4% REA Top 20% for Shear Force
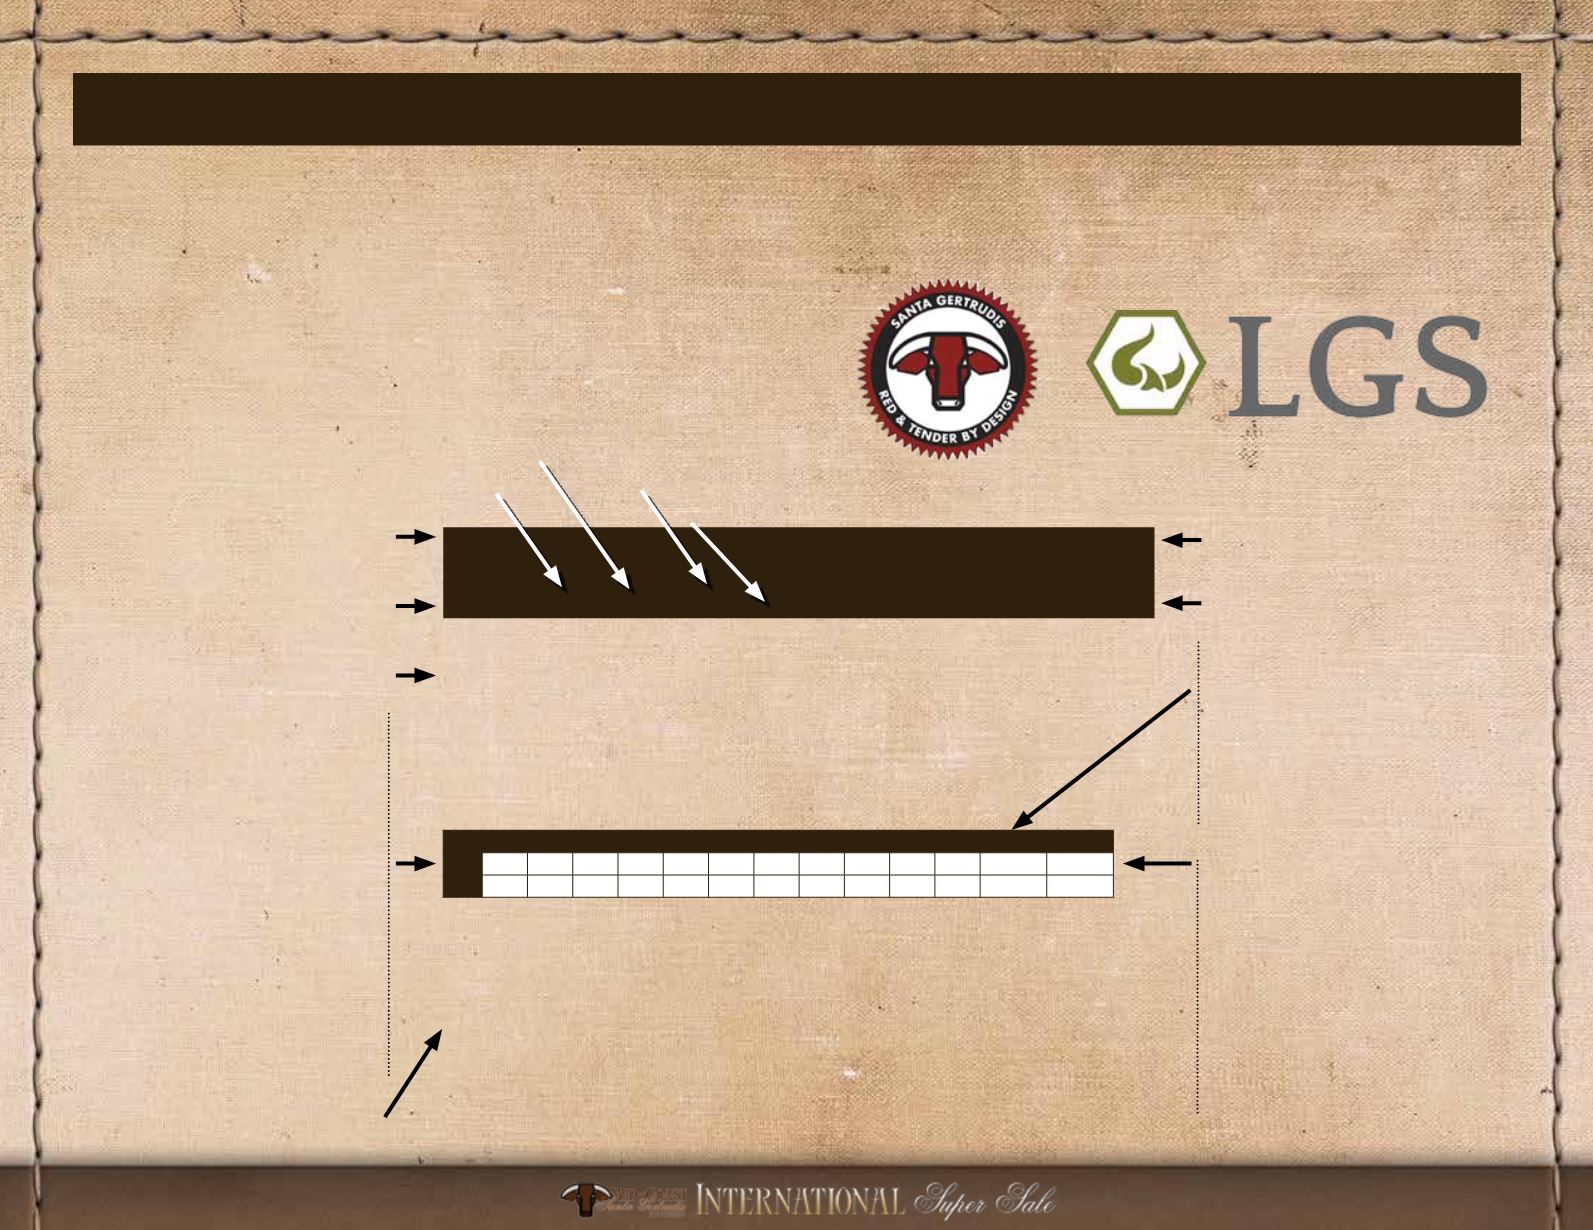
Lot Number
Name
Registration Number
Animal ID
Birthdate
Polled/Scurred/Horned
Category
Consignor
Three Generation Pedigree
SGBI Expected Progeny Differences:
Expected Progeny Differences, EPDs, are the
prediction of how future progeny of each animal
are expected to perform relative to the progeny
of other animals listed in the SGBI database. EPDs
are expressed in units of measure (plus or minus)
for each trait being evaluated and are calculated
utilizing pedigree and performance information.
In 2014 Santa Gertrudis Breeders International
released the first genomic-enhanced expected
progeny differences (DNA verified) for Bos indicus
influenced cattle. The inclusion of DNA into the
breed’s EPD calculations (GE-EPDs) result in infor-
mation that is more accurate and predicable than
a pedigree and performance prediction alone.
SGBI is a leader in the adoption and implementa-
tion of genetic technology and the association’s
database contains over 4,000 DNA samples
genotyped with the GeneSeek Genomic Profiler.
Breeding/Calf Information.
Followed by footnotes.
SGBI Growth Index:
The growth index puts together weaning
weight and yearling weight. SinceWW is
contained in YW, post wean gain (PWG) is
used in the index to prevent double counting
WW. As an example of the index, if an animal
has a +30 growth index, their offspring will be
on average worth $30 more as yearling than
the breed average, based strictly on weight.
SGBI Carcass Rank Index:
The carcass rank index contains marbling
score, hot carcass weight, ribeye area, backfat,
and tenderness and is weighted by the
economics of carcass values. It is expressed as
a numerical ranking within the breed from 1
-10 with 10 being the highest. For example,
an animal with a score of 9 would be in the
80th percentile or would be better than 80%
of the population in carcass composition. A
ranking of 6 would place the animal in the
50th percentile.v
The Santa Gertrudis Breeders International genetic evaluation is one of the most comprehensive among the Bos indicus breeds. The evaluation system, developed for the association
by Livestock Genetic Services, has been reviewed by the nation’s leading animal geneticists and utilizes genotypes collected from the breed’s leading sires and validated on 10K, 20K,
and 50K SNP Chips. Thousands of ranch phenotypes and scan records collected over a 25 year period serve as the foundation of the genetic evaluation. SGBI’s reliable genetic evaluation
ensures that cattlemen can make sound selection decisions, identifying those animals that will perform in the most challenging of environmental conditions.
John Ford
John Genho
Executive Director
President
Santa Gertrudis Breeders International
Livestock Genetic Services
BW WW YW MILK TM HCW FAT MARB REA SH.F.
SC
GR IDX CRC IDX
EPD
0.72 12.76 19/26 5.09 11.47 13.92 0.00 -0.02 0.17 -0.01 0.59 $18.59
10
ACC
.10 .28 .16 .14 --
.12 .13 .09 .11 .01 .09
--
--


