26
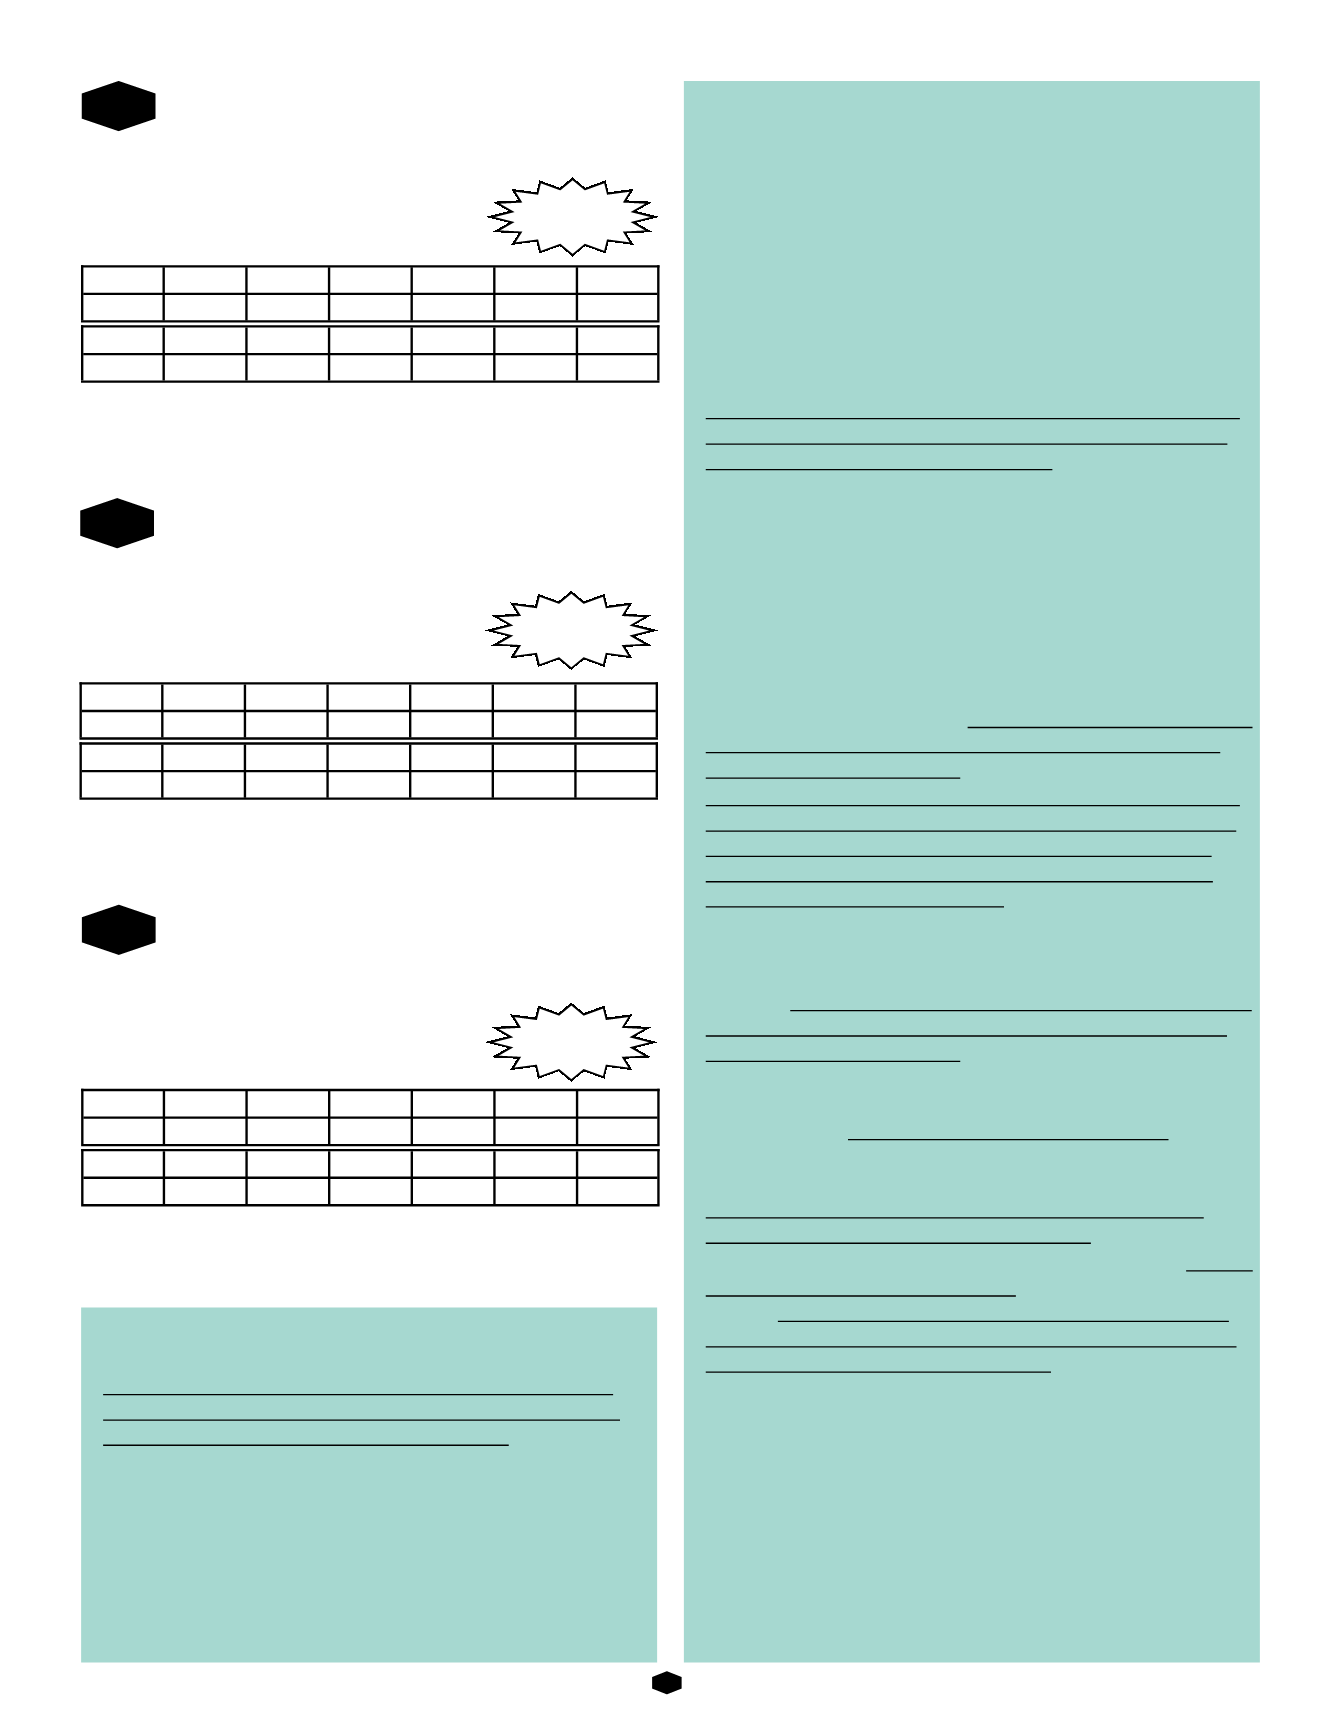
BARRETT 5267 110 DA
Calved: 8/22/15
Reg#: 18502555
Tattoo: 5267
Sitz Upward 307R
Actual Scrotal: 38.5 cm
Sitz Dash 10277
Sitz Everelda Entense 2665
SAV Net Worth 4200
Barrett Rita 110 of 1709 NW
Barretts 1709 of 1204 5522
Lots of powerhouse cattle behind this bull! Generations deep of cattle select-
ed for 50+ years of growth, power, maternal. This bull should leave excellent
daughters. Dash only adds to the quality females this bull should sire.
110
CED
BW
WW
YW
SC
CEM
Milk
+9
+.2
+50
+85
+.54
+12
+21
CW
Marb
RE
Fat
$EN
$W
$B
+26
+.53
+.61
+.053
+12.13
+58.88
+96.46
BARRETT 5268 118 DA
Calved: 9/16/15
Reg#: 18502556
Tattoo: 5268
Sitz Upward 307R
Actual Scrotal: 36.5 cm
Sitz Dash 10277
Sitz Everelda Entense 2665
SAV Net Worth 4200
Barrett Rita 118 of 1709 NW
Barretts 1709 of 1204 5522
111
CED
BW
WW
YW
SC
CEM
Milk
+13
+.1
+38
+72
+1.56
+14
+21
CW
Marb
RE
Fat
$EN
$W
$B
+27
+.65
+.45
+.058
+9.39
+37.48
+96.69
Potential
Heifer Bull on
Larger Heifers
Potential
Heifer Bull on
Larger Heifers
How to control costs & spur cowherd revenues,
Wes Ishmael, reprinted with permission, BEEF Magazine
“Controlling cost in the cow-calf sector is more important
than creating revenue,” said David Lalman, Extension beef
cattle specialist at Oklahoma State University.
In part, Lalman explained to those attending this summer’s
annual meeting of the Beef Improvement Federation (BIF),
the reason is that the cost of adding a pound of weaning
weight is about the same as its value over time.
For instance, the cost per hundredweight of calf produced in
Texas, Oklahoma and New Mexico increased an average of
$5 per year from 1991 to 2015, according to data from the
Southwest Cow-Calf Standardized Performance Analysis (SW-
High $EN, high heifer pregnancy, low mature weight—easy-maintaining fe-
males expected. Extremes are easy to brag about—but breeders need to look
at the whole picture. Dash semen is limited because he has been used a lot.
I wonder why?
SPA). Calf prices increased an average of $5.25 per year.
Likewise, data from the Kansas Farm Management Associa-
tion (KFMA) at Kansas State University (K-State) show the
cost per pound of additional weaning weight from 2010 to
2014 was about .96 (basis 90% weaning rate), while the value
was about .86 (basis Oklahoma City mean average).
“On average, the cost associated with increasing weaning
weight in the Kansas data was slightly greater than the value
of increased weaning weight,” Lalman explained. “The rela-
tive value of additional weaning weight is highly variable over
time, and therefore, the profitability of managing to achieve
greater weaning weight will be highly variable over time.
Clearly, in the context of an enterprise that sells at weaning,
there is more low-hanging fruit in cutting or managing cost
than there is in increasing production.”
Lalman and other researchers at OSU and K-State also looked
at cow-calf benchmarking data — too scarce in the industry
— from the Cow Herd Appraisal Performance System
(CHAPS) program at North Dakota State University; and
FINBIN, data from the Center for Farm Financial Manage-
ment at the University of Minnesota.
The breakeven nature of weaning weight over the long haul
may offer a plausible explanation for the fact that weaning
performance — measured by such databases — remains
mostly static across decades, despite the fact that the genetic
trend for growth in the heaviest-used breeds continues to
increase at a significant rate.
“It may be that genetic potential for production of the seed-
stock sector has simply advanced beyond what the environ-
ment or resources will allow in these regions,” suggested
Clay Mathis, director of the King Ranch Institute of Ranch
Management, at the BIF meeting.
“It is possible that the SPA summaries from the Southwest
and Northern Plains simply show optimization, and that re-
sources are dictating an upper limit to cost-effective perfor-
mance … There is opportunity to improve pregnancy rate and
weaning rate, but the marginal cost of higher performance
may be prohibitive,” he said.
Although calf prices increased 88% between the two eight-
year periods of 1988 to 1995 and 2008 to 2015, when adjust-
ed for inflation, Mathis pointed out prices rose 18%.
At the same time, inflation-adjusted costs — especially those
that matter most to ranch profitability — continue higher.
For instance, the inflation-adjusted cost of labor was 9%
higher, and the cost of feed was 24% more.
“Half of the expenses for a cow-calf enterprise can be catego-
rized as depreciation, labor or feed,” Mathis said. “Other ex-
penses, like repairs and maintenance, fertilizer, fuel, leases
and veterinary services are important when taken together,
but independently are less important.”
In the most recent KFMA data, Lalman explained 67.8% of
the profitability differences between the top third and
bottom third of producers was due to lower cost of produc-
tion of the highest-profit producers.
“Future efficiencies and profits will not be mutually exclusive
efforts to controlling costs and increasing revenues,” Mathis
said. “Success will come from optimizing expenses and per-
formance by building a production system that will yield the
lowest unit cost of production for the most valuable calf that
can be produced in the operational environment.”
BARRETT 5272 253 DA
Calved: 9/12/15
Reg#: 18502558
Tattoo: 5272
Sitz Upward 307R
Actual Scrotal: 34 cm
Sitz Dash 10277
Sitz Everelda Entense 2665
SAV Net Worth 4200
Barrett Pride 253 1406 NW
Barretts Pride 1406 210 423
Dash is one of the highest $W bulls in the breed with his kind of accuracy.
Low accuracy bulls change with time generally. That’s why we like to wait—
slower? Maybe… but actually faster in the long run!
109
CED
BW
WW
YW
SC
CEM
Milk
+6
+2.2
+51
+92
+.73
+10
+24
CW
Marb
RE
Fat
$EN
$W
$B
+26
+.69
+.43
+.051
-.70
+50.11
+98.96
Potential
Heifer Bull on
Larger Heifers


