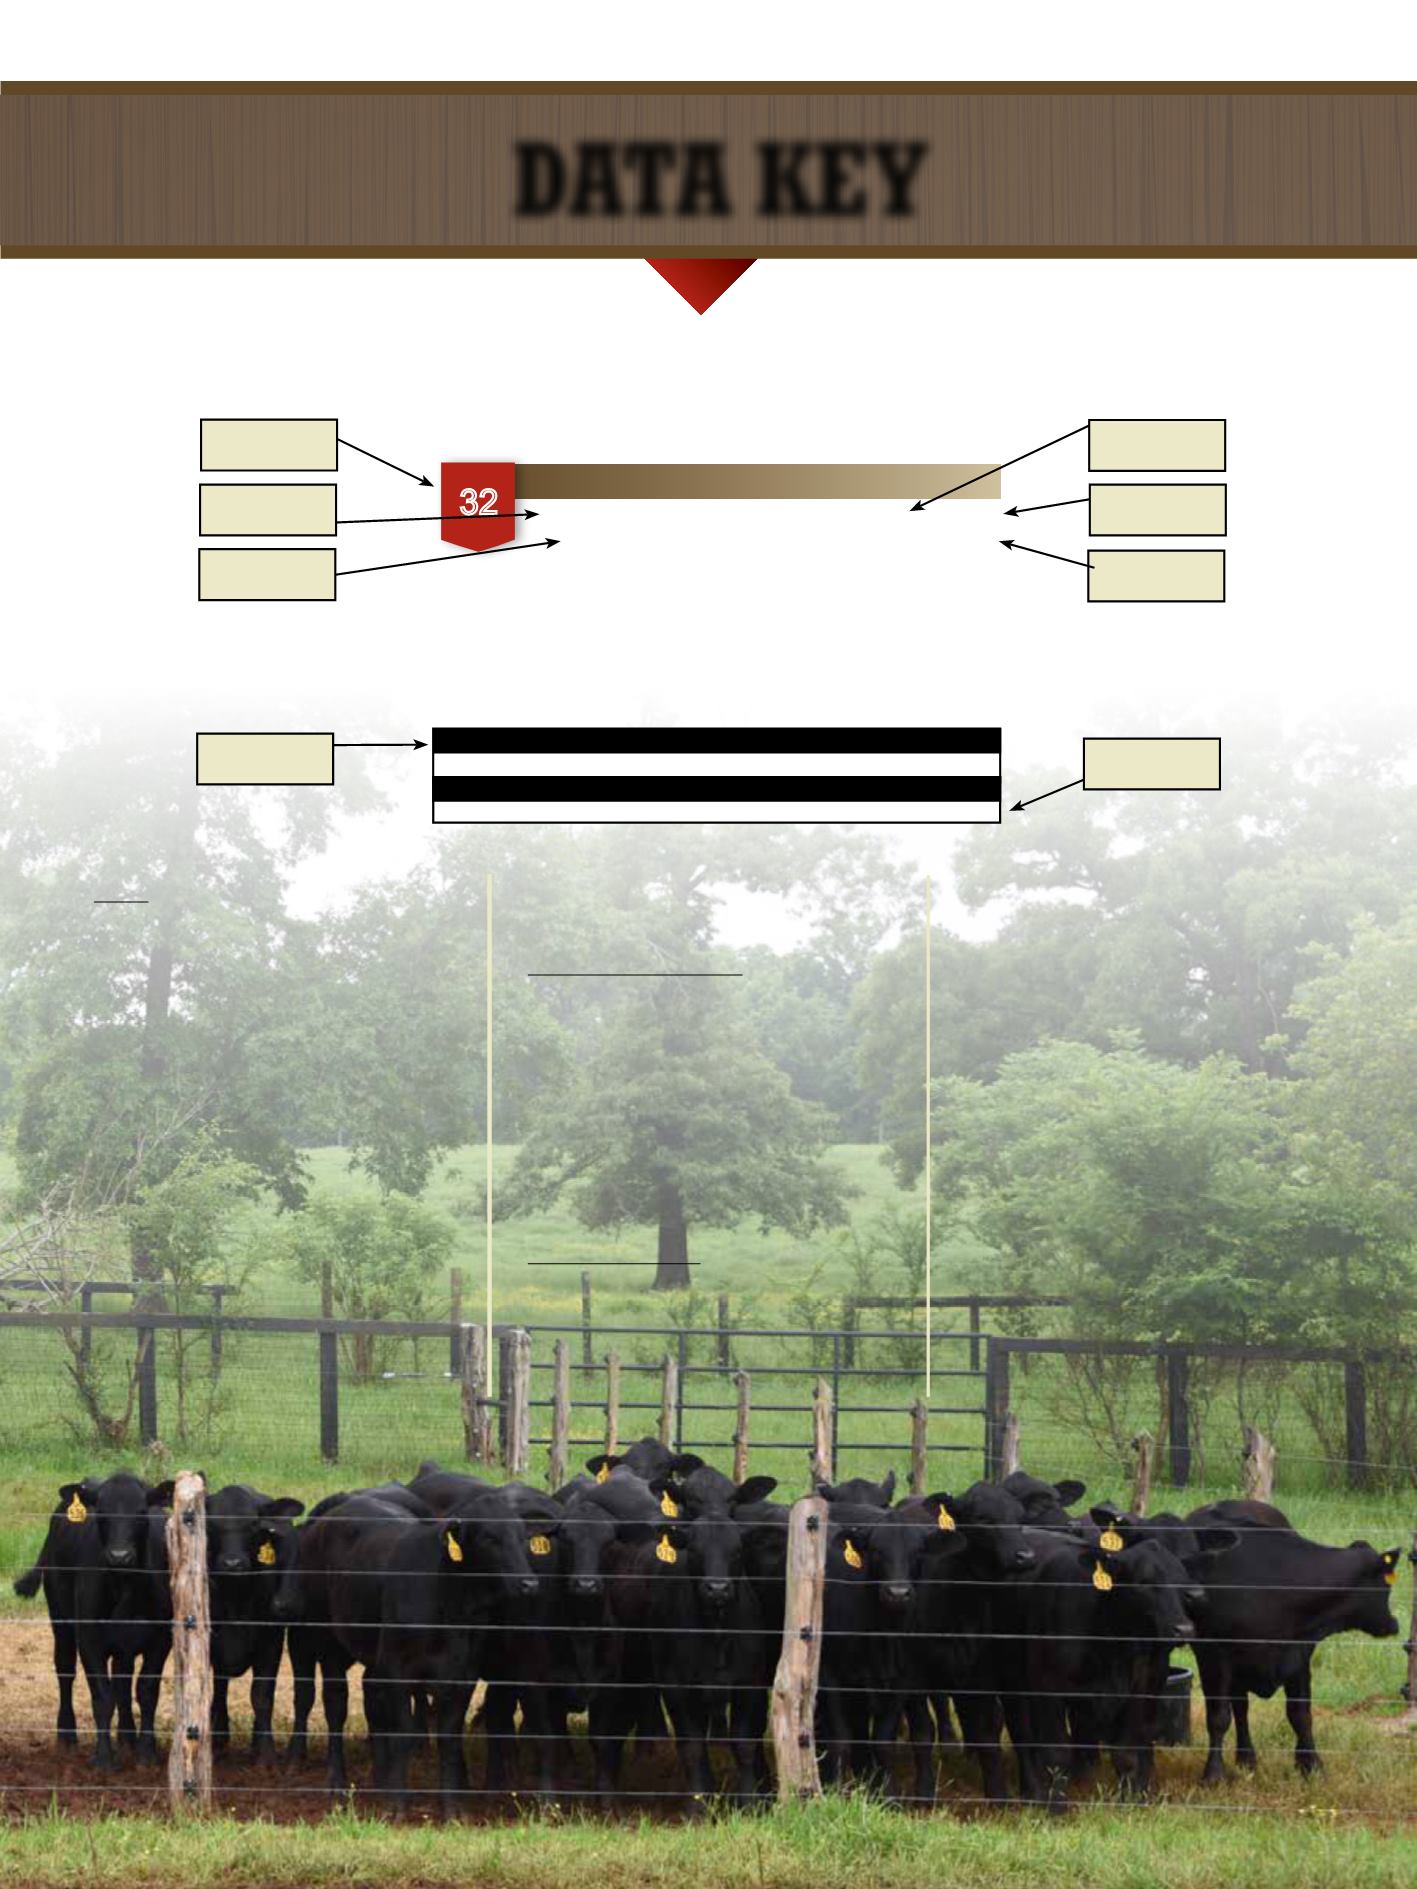
Lot
Number
Age/
Classification
EPD’s
Individual
Performance
Please make note that the many of the animals were in different contemporary groupings at
weaning; therefore, it is not fair to compare birth, weaning and yearling weights from
one herd to another.
CBCHISHOLM415B2
32
Breeder/
Owner
Registration
Number
Date of
Birth
Service Type
(AI, ET, NS)
EPDs
Expected Progeny Difference
(EPDs) is the
best estimate of an animal’s genetic merit for
a particular trait. It takes into account the
animals’ own performance compared with its
contemporaries and the performance of its
relatives compared against their contemporaries.
Birth Weight (BW)
EPD predicts
calf size and calving ease.
Weaning Weight (WW)
EPD predicts
preweaning growth potential.
Yearling Weight (YW)
EPD predicts overall
growth potential.
Milk EPD
predicts the maternal contribution
to weaning weight of the calf through milk
production, behavior, immunity and other
maternal environmental factors.
Total Maternal (TM) also, called M&G
EPD
predicts weaning weight of calves from a bull’s
daughters.
Scrotal Circumference (SC)
EPD predicts
testicular size in puberty.
ULTRASOUND EPDs
Ribeye Area (REA)
EPD predicts total muscle.
Intramuscular Fat (IMF)
EPD predicts % of
intramuscular fat which is highly correlated to
marbling.
Fat Thickness (FT)
EPD predicts external fat
thickness.
*REA and FT are primary components of USDA
YG and marbling is the primary component of
USDA QG.
PERFORMANCE
Individual performance data is provided as
supplementary information as EPDs provide
more reliable evaluation of genetics differences
of animals.
Actual Birth Weight (BW)
are reported.
Weaning Weight (WW)
are adjusted to 205
days.
Yearling Weight (YW)
are adjusted to 365 days.
Scrotal Circumference (SC)
is adjusted to 365
Average Daily Gain (ADG)
is a measure of
growth rate on a high energy diet. It is positively
associated with feed efficiency.
Ribeye Areas (REA)
are adjusted to 365 days
and ratioed relative to contemporaries.
Intramuscular Fats (IMF)
are adjusted to 365
days and ratioed relative to contemporaries. IMF
is highly correlated to marbling.
Fat Thickness (FT)
is adjusted to 365 days and
ratioed relative to contemporaries.
Brangus EPDs are calculated by the Livestock
Genetic Services and are part of a program
called the National Cattle Evaluation (NCE).
R10275244 Polled Gen: 5
2/21/2014
ET
CAVENDER BRANGUS
Coming Two Year Old
LTD OF BRINKS 415T28
SUHN’S CHISHOLM 331W45
SUHNS MISS AFFIRMED 331S34
BLANDA OF BRINKS 535R54
CB MS BLANDA 415X7
MS BRINKS BRIGHT SIDE 415R23
CED BW WW YW M TM CEM SC REA IMF FT
BW WW YW ADG WDA SC REA IMF FT
88
686 1133 2.8 3.08 40.2 14.21 4.41 0.27
3.1 2.8 27 47 10 23 3.7 0.87 0.43 0.0 -0.040
CSONKA OF BRINKS 30R4
MS BRINKS BRIGHT SIDE 415P5
SUHN’S AFFIRMED 416N4
SUHN’S MISS CADENCE 331L2
SUNDANCE OF BRINKS 392G9
MISS BRINKS TROOPER 535F61
BRINKS BRIGHT SIDE 607L11
MISS BRINKS VAQUERO 415G
Data Key


