CBTHREED924D19
CED BW WW YW M TM CEM SC REA IMF FT
BW WW YW ADG WDA SC REA IMF FT
83
653 1171 3.27 3.28 39.2 14.40 4.08 0.28
2.4 2.0 48 81 5 29 4.0 0.65 0.58 -0.09 -0.046
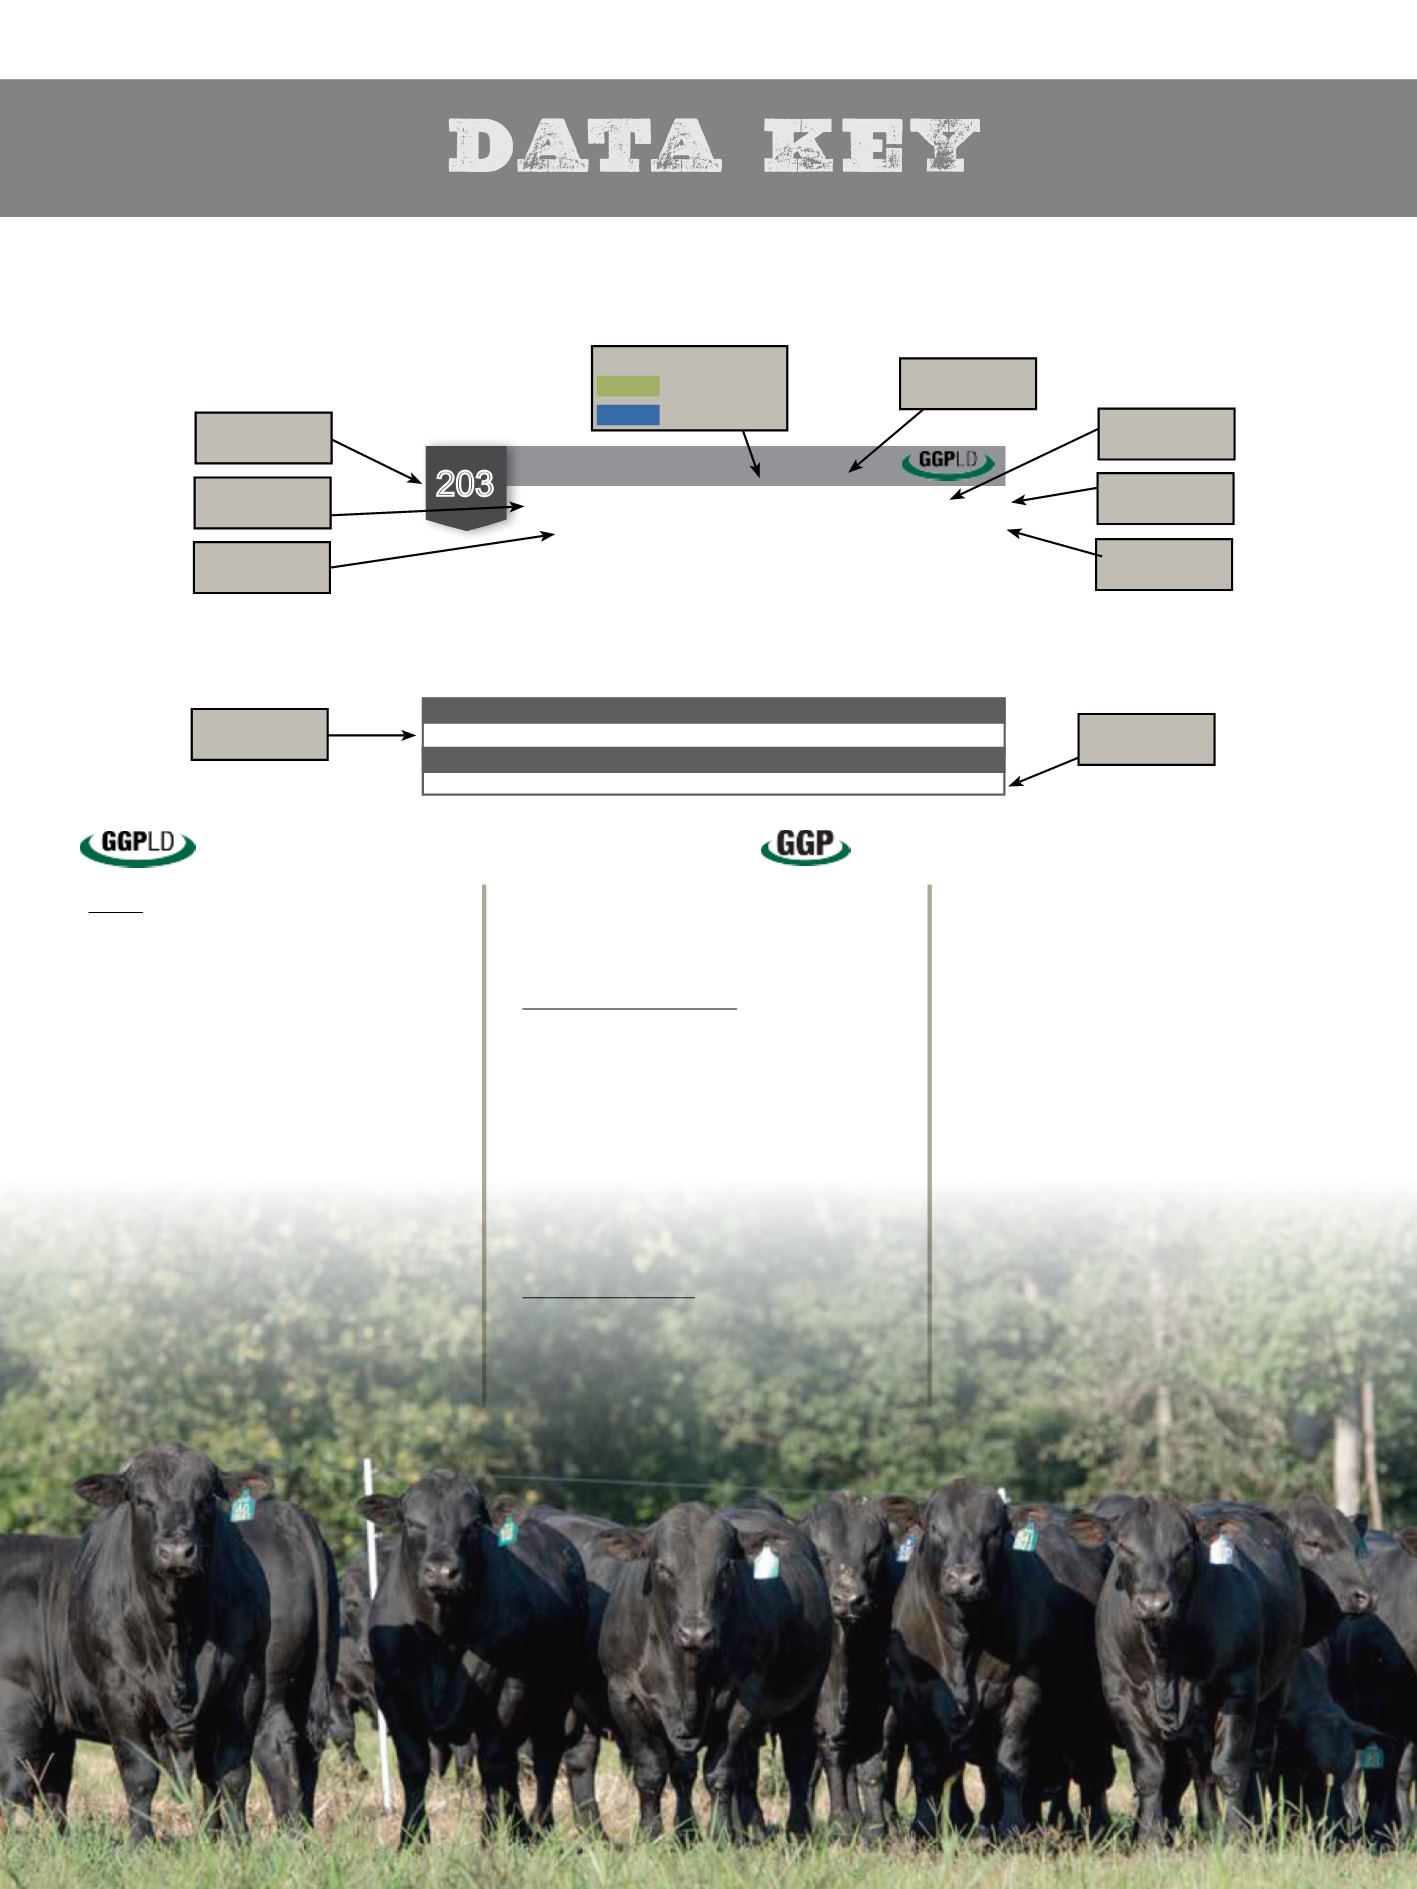
Age/
Classification
Individual
Performance
Please make note that the many of the animals were in different contemporary groupings at weaning; therefore, it is
not fair to compare birth, weaning and yearling weights from one herd to another.
Date of
Birth
Service Type
(AI, ET, NS)
EPDs
Expected Progeny Difference
(EPDs) is the
best estimate of an animal’s genetic merit for
a particular trait. It takes into account the
animals’ own performance compared with its
contemporaries and the performance of its
relatives compared against their contemporaries.
Birth Weight (BW)
EPD predicts
calf size and calving ease.
Weaning Weight (WW)
EPD predicts
preweaning growth potential.
Yearling Weight (YW)
EPD predicts overall
growth potential.
Milk EPD
predicts the maternal contribution
to weaning weight of the calf through milk
production, behavior, immunity and other
maternal environmental factors.
Total Maternal (TM) also, called M&G
EPD
predicts weaning weight of calves from a bull’s
daughters.
Scrotal Circumference (SC)
EPD predicts not
only testicular size of male progeny but also
daughters onset of puberty
ULTRASOUND EPDs
Ribeye Area (REA)
EPD predicts total muscle.
Intramuscular Fat (IMF)
EPD predicts % of
intramuscular fat which is highly correlated to
marbling.
Rib Fat Thickness (FT)
EPD predicts external
fat thickness.
*REA and FT are primary components of USDA
YG and marbling is the primary component of
USDA QG.
PERFORMANCE
Individual performance data is provided as
supplementary information as EPDs provide
more reliable evaluation of genetics differences
of animals.
Actual Birth Weight (BW)
are reported.
Weaning Weight (WW)
are adjusted to 205
days.
Yearling Weight (YW)
are adjusted to 365 days.
Scrotal Circumference (SC)
is adjusted to 365
Average Daily Gain (ADG)
is a measure of
growth rate on a high energy diet. It is positively
associated with feed efficiency.
Ribeye Areas (REA)
are adjusted to 365 days
and ratioed relative to contemporaries.
Intramuscular Fat (IMF)
are adjusted to 365
days and ratioed relative to contemporaries. IMF
is highly correlated to marbling.
Fat Thickness (FT)
is adjusted to 365 days and
ratioed relative to contemporaries.
Brangus EPDs are calculated by the Livestock
Genetic Services and are part of a program
called the National Cattle Evaluation (NCE).
Genetic Defect
Code if Applicable
Ultrablack
UB 1
UB 2
75% Brangus
50% Brangus
Sire parentage has been verified plus current Genomically Enhanced EPDs
Sire parentage has been verified and GE-EPD’s will be available Dec. 1st.
203
R10339273 Polled GEN: 5 10/6/16 ET
CAVENDER BRANGUS
Yearling
CB FINAL CUT 924X
TJM THREE D 302A
OAKS MS PATTON 302X3
CB HOMBRE 541T3
CB MS HOMBRE 924Z11
RBM MS GUNS 924T3
MC REVELATION 129T
RBM MS GUNS 924T3
PATTON OF BRINKS 30T22
MISS BRINKS GERONIMO 302H6
SUHN’S AFFIRMED 416N4
MS BRINKS BRIGHT SIDE 541K28
MC GUNS DONOVAN 124R
RBM MS 52 COOL HAND 924R
Lot
Number
EPD’s
Breeder/
Owner
Registration
Number


