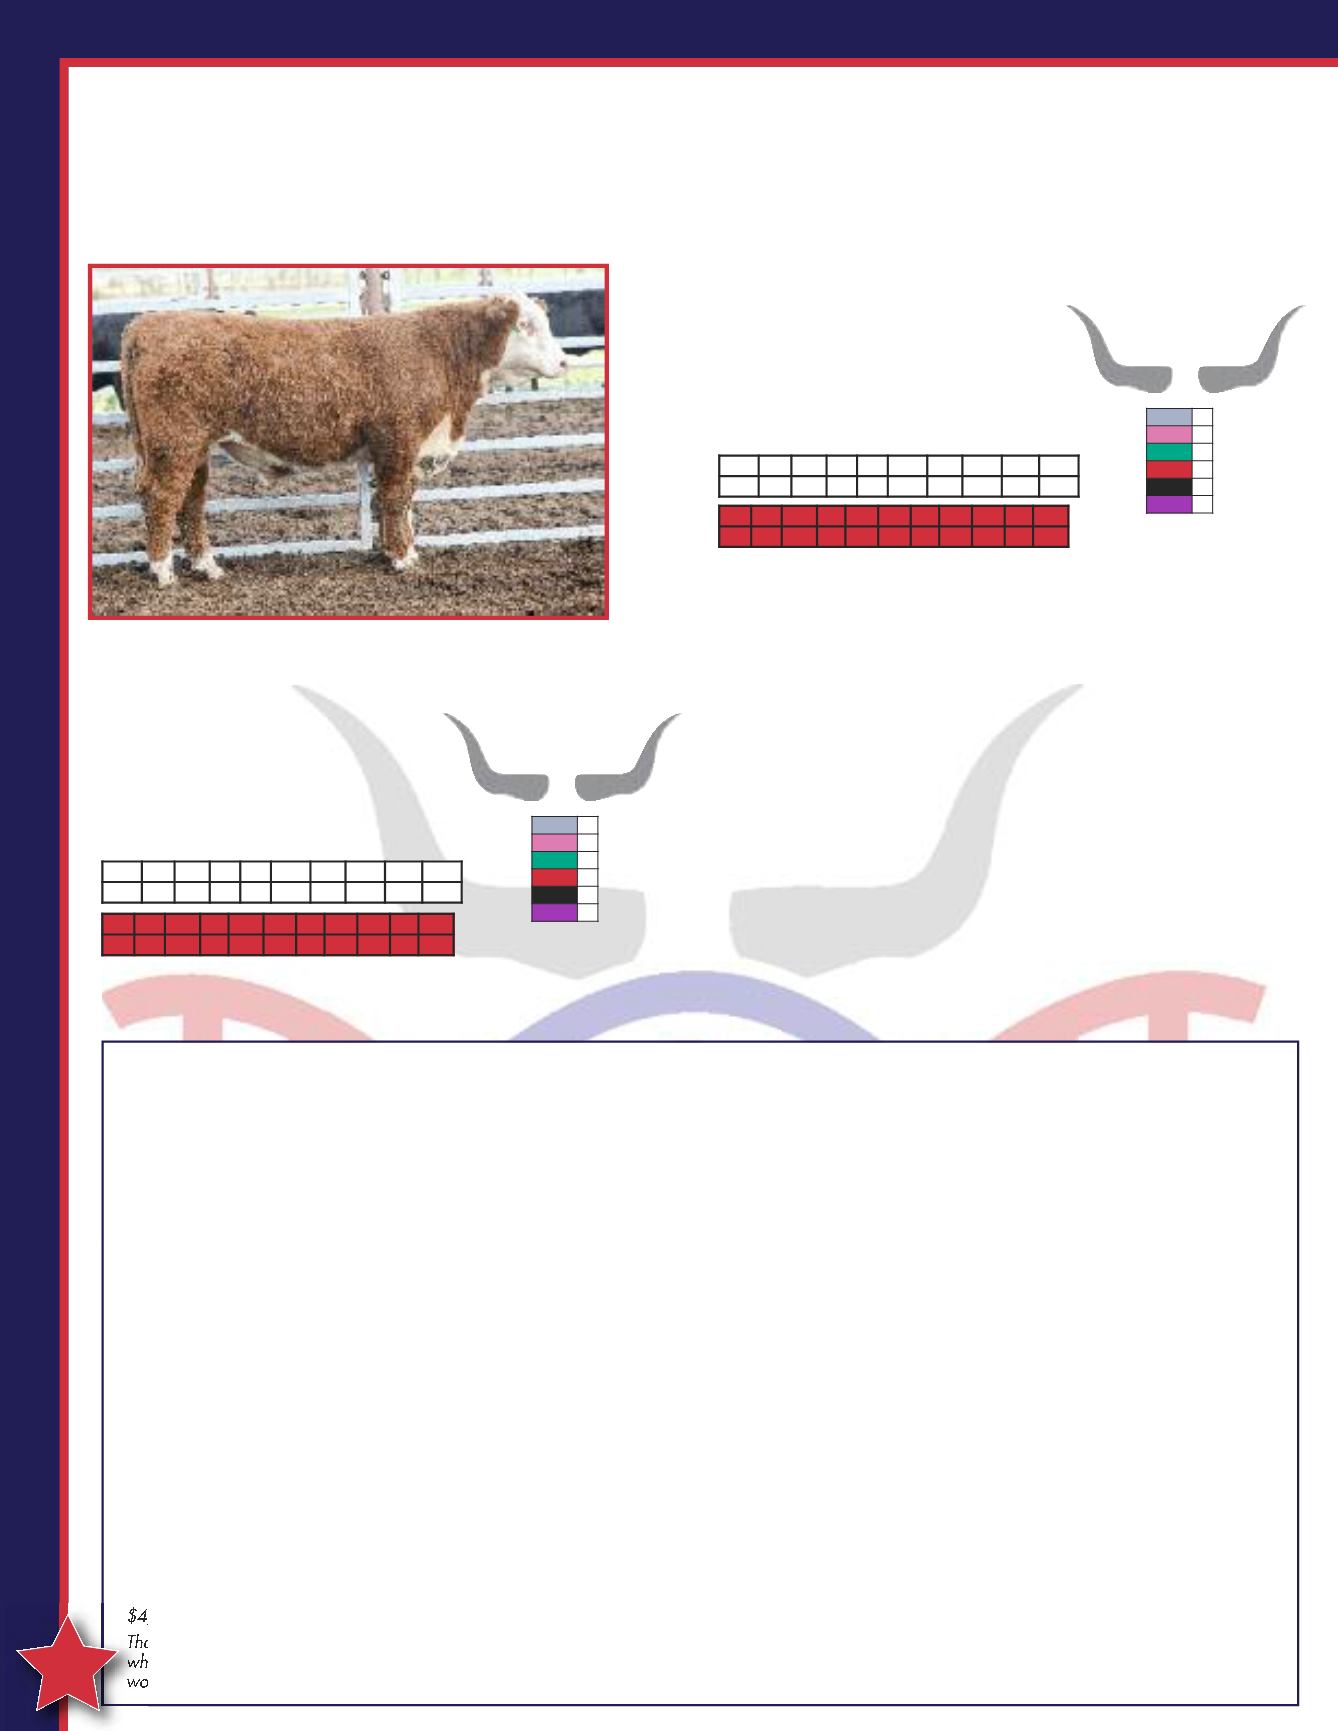
Lot 104
CE
H
MAT
GROW
MEAT
FEED
PHENO
W4 T154 DOMINO B074
AHA BULL 43520591
DOB: 3/01/14
HORNED
TAG: 676
C 212 DOMINO 4011 ET
W4 4011 DOMINO T154
RCR AURUM PAT DOMET E 04092
CHURCHILL DOMINO 4137 ET
B CHURCH LADY 759
B LADY BULLSEYE 529
Act BW 63 | 205D Adj Wt
is super-thick and easy-doing bull offers excellent across-the-board
performance and toughness.
W4 RANCH
CED BW WW YW M M&G SC FAT REA MARB
2.8 3.3 49 80 23 48 0.9 -.036 0.72 0.07
2-11-15
Wt.
ADG
ADG
Ratio
F:G
F:G
Ratio
RFI DMI REA
REA
Ratio
IMF
IMF
Ratio
1155 3.93 100 5.98 100.6 1.37 25 13.12 107 3.25 87
HORNED HEREFORD BULLS
10 Excellent Yearlings from W4 Ranch
Lot 103
CE
MAT
GROW
H
MEAT
FEED
PHENO
W4 136Y DOMINO B127
AHA BULL 43547855
DOB: 3/27/14
HORNED
TAG: 684
CL 1 DOMINO 955W
W4 955 DOMINO 136Y 2ET
C MS PURE GOLD 5007 ET
UPS DOMINO 3027
CHURCHILL LADY 0105X
CHURCHILL LADY 8207U
Act BW 63 | 205D Adj Wt
Exceptional performance for gain and the amount of feed it took to put it
on, this bull is a favorite for overall design and quality.
W4 RANCH
CED BW WW YW M M&G SC FAT REA MARB
3.3 3.8 51 85 30 55 0.9 0.018 0.30 0.18
2-11-15
Wt.
ADG
ADG
Ratio
F:G
F:G
Ratio
RFI DMI REA
REA
Ratio
IMF
IMF
Ratio
1135 4.50 114 5.08 118.5 0.99 24 11.61 95 3.71 99
By W. Travis Meteer, University of Illinois Extension Beef Specialist
A popular question this time of year is “How much can I afford to pay for a
bull.” My go-to answer is usually—“How much revenue loss would you have
from a pasture full of open cows?” After all, we often de-value the role of the
bull. We forget that he is a crucial part of the equation to making our product.
Now, the question is a good one to ask. Especially after watching calf
prices climb seemingly all of 2014 and the prices paid for bred heifers at
year-end, it is only logical to wonder what a good bull will cost this spring.
Old rules of thumb are good to reflect on. For instance, “2 times the value of a
fat steer” or “4 to 5 times the value of a feeder calf”, are both common meas-
ures used by old-timers to determine the value of a bull. So, I tested these fig-
ures with historical prices from the Illinois Performance Tested Bull Sale and
prices paid for feeders and fats from National Agricultural Statistics Service
(NASS). As it turns out, using values from 1996 to 2014 (the last 19 years)
the average bull price was 4 times the value of a feeder calf and 2.1 times the
value of a fat steer. Looks like those old rules of thumb work pretty well.
Using these multipliers, we can speculate to the average price of bulls this
coming sale season. Looking at recent market reports, 500-pound feeder
calves are bringing $2.40 or more. Thus, value of a 5-weight feeder calf is
conservatively $1200. History tells us 4 times that value will get us close to
the average. Thus 4 x $1,200 = $4,800 for an average bull price.
A conservative price for fat steers weighing 1,300 pounds is $1.50. There-
fore the math tells us a fat steer values out at nearly $2,100. The previously
stated multiplier of 2.1 times the value of a fat steer would yield an average
bull price of just over $4,400. Thus, we have a conservative range of
$4,400 to $4,800 for the average full price.
That said, there will be many bulls that bring in excess of those figures. So,
what factors contribute to bulls bringing more than the average? Are they
worth the extra money?
For simplicity, let’s say a bull breeds 25 cows per year for four years resulting
in 100 calves over his lifespan. With these conservative assumptions, even a
small improvement in a valuable trait can greatly increase a bull’s value.
For instance, Calving Ease (CE) EPD is defined as the difference in percent-
age of unassisted births. So, let’s say you purchase a bull that is 5 points
better in his CE that the breed average for current sires. For both Angus
and Simmental, that would mean purchasing a bull in the top 10 percent of
the breed for that trait—not an unrealistic buy. The 5-point improvement
should translate to 5 percent more unassisted births. In the real world, it’s
fair to say half of assisted births don’t make it. Thus a 5 percent improve-
ment in CED could easily translate to 2.5 percent more calves. Out of 100
calves sired over a lifetime, that 2.5 more calves. The added value from im-
proved CE would be $3,000 (2.5 more calves x 500 lbs x $2.40/lb.)
The most common example for added value of a bull is improved EPDs for
weaning weight (WW). Let’s say you purchase a bull with a WW EPD of
60 (breed average for Angus is 50). That’s 10 additional pounds at wean-
ing per calf. If the bull sires 100 calves in a lifetime and a pound is worth
$2.40, then the result is $2,400 more income over his lifetime when com-
pared to the average of current sires.
When selecting your next herd sire, identify the traits that can add dollars to
your operation. Don’t sacrifice functionality, structural soundness, docility, and
other traits that an affect longevity. View purchasing a bull as an investment
and treat it as such. Investing in a good bull that can improve profitable traits in
your herd can allow you to be more competitive no matter the market dynamic.
Bottom line, bulls are a significant contributor to profit or loss in your cattle
herd. They have an impact now and for years to come if you are retaining
replacement females. Look for traits that hold value in your market. Find a
bull that can inject those traits. The “expense” of a bull can be a great in-
vestment in the future of your cattle herd.
HOW MUCH CAN I AFFORD TO PAY FOR A BULL?
30


